- Introduction & key concepts
-
Introduction & key concepts 3 min
- Creating the slide visuals
-
Slide visual walkthrough 2 min
- Building the charts
-
Creating the build-up waterfall chart pt. 1 4 min
-
Creating the build-up waterfall chart pt. 2 3 min
-
Creating the table visualization 3 min
- Completion
-
thinkcell contribution to change quiz 2 min
-
Share your feedback
-
Complete course 1 min

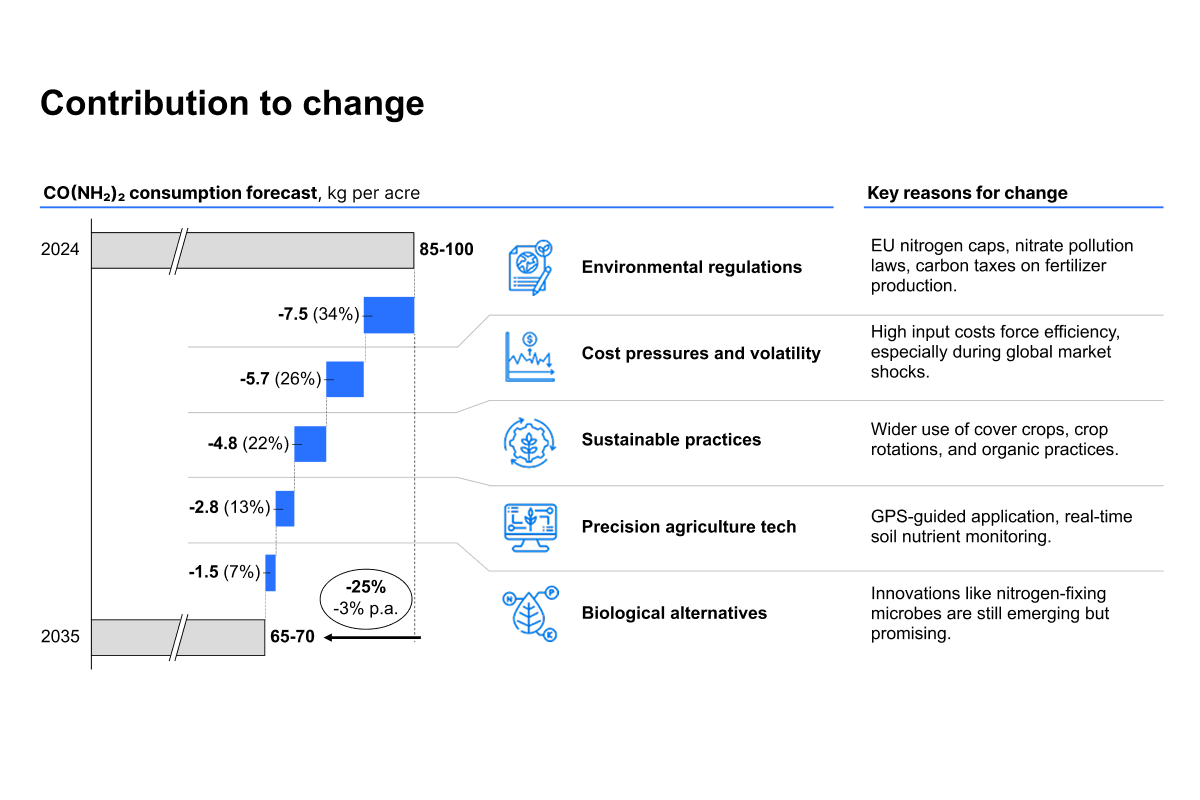
Contribution to change
Learn how to effectively communicate change drivers using thinkcell’s waterfall chart
By the end of this course, you’ll be equipped to clearly communicate change drivers using thinkcell’s waterfall chart, turning raw data into compelling, insight driven business narratives.
- Quantify key change drivers: Learn how to break down overall change into its most impactful components- whether you're explaining cost reductions, market shifts, or KPI improvements.
- Design MECE-driven visuals: Apply the principles of Mutually Exclusive and Collectively Exhaustive categorization to ensure your waterfall charts are complete, logical, and easy to understand.
- Build structured forecasts with clarity: Use thinkcell to chart long-term changes (like NPS growth or consumption decline) with precise contributions, showing both absolute and percentage deltas over time.
- Guide decisions with annotated detail: Go beyond the chart-add supporting tables that outline initiative descriptions, resource needs, timelines, and departments responsible for each change factor.
These powerful techniques will help you build data stories that drive clarity, action, and alignment- essential for any professional turning insights into decisions.