Two variable comparison

Learn how to compare and visualize two variables

rate limit

Code not recognized.

About this course

By the end of this course, you’ll be equipped to build clear and insightful benchmarking scatter charts using thinkcell’s charting and layout tools, enabling you to visualize two-dimensional performance comparisons, pinpoint efficiency gaps, and map out peer positions across industries or business units.

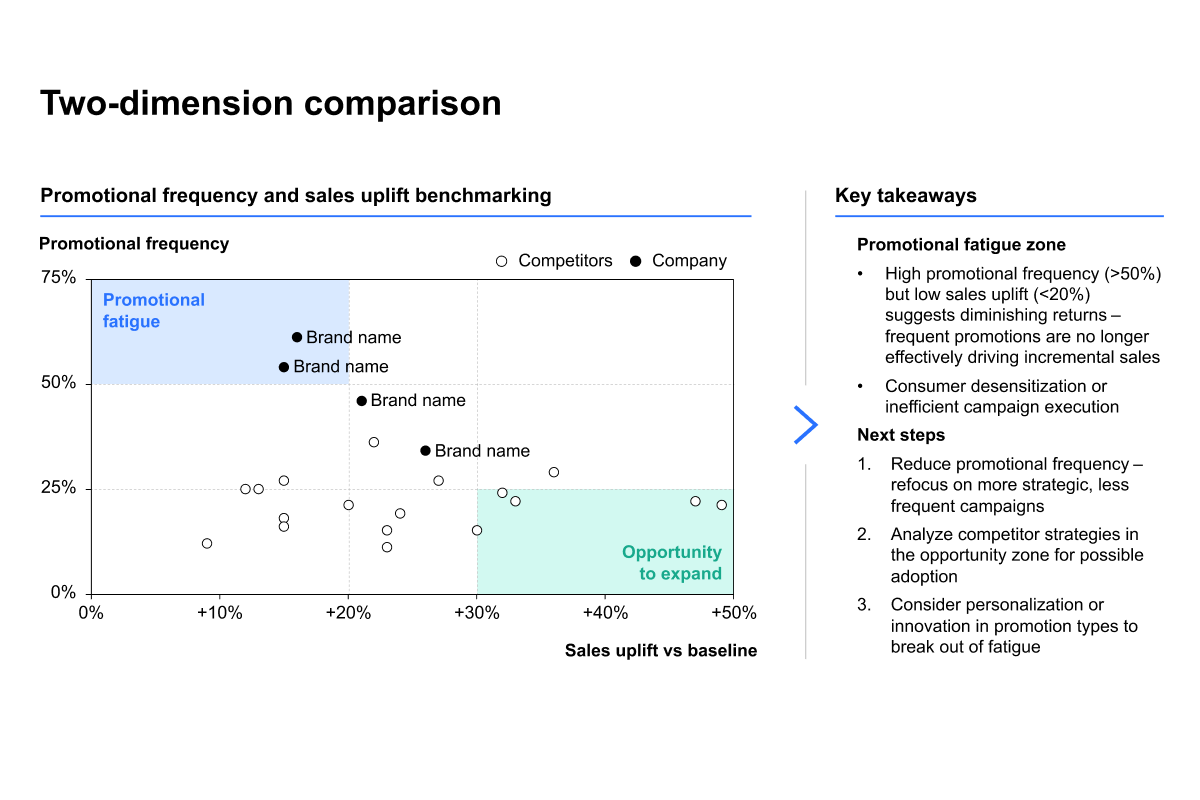
  • Clarity through scatter charts: Learn how to structure comparisons across two key dimensions, such as resource intensity versus asset base, or promotional frequency versus sales uplift.
  • Insightful benchmarking analysis: Master the use of quadrant partitioning, sector definitions, and peer grouping to highlight both strengths and weaknesses, showing not just where companies stand but what those positions mean.
  • Deep-dive storytelling: Apply thresholds, trend lines, and target markers to illustrate evolution over time, uncover patterns across competitors, and define ambition levels or desired end states that make strategic goals concrete.

These techniques will help you create executive ready benchmarking presentations that are easy to understand.


Curriculum27 min

  • Introduction & key concepts
  • Introduction & key concepts 7 min
  • Chart walkthrough 4 min
  • Creating the slide visuals
  • Building the scatter chart 7 min
  • Defining the sectors 7 min
  • Completion
  • Two variable comparison quiz 2 min
  • Share your feedback
  • Complete course 1 min